“When all the guns fell silent….”
Today is Remembrance Day, where on the eleventh day of the eleventh month, at the eleventh hour, we commemorate those who served and died in war. The wars of the past century are almost too numerous to count, and the human experience is complex and varied. We had the privilege today of experiencing parts of four similar but very different commemoration ceremonies.
The first was at the war memorial for the 48th Highlanders. There was a brief parade from near the legislative building, with numerous soldiers, accompanied by pipes and drums[1]. This was followed by a surprisingly poignant speech by (I presume) the head of the war monuments commission about the monument itself, which was commemorating its own 100 year anniversary. He noted that monuments are designed and built to appear (and to be) timeless and eternal, but over a hundred years (and often more), there is the addition of battles and names to commemorate (and the inevitable restoration work), such that the monuments have their own history as well.
There was also the beautifully sung ‘Oh God our Help in Ages Past‘ hymn, where we could see the lined up veterans reading the program and singing along, but I could only see a group of young soldiers singing to comfort themselves and each other in the trenches.
To me, Remembrance day has always felt like it should be a poignant and simple ceremony, where there are a few simple words to trigger the poignant memories, followed by silence to fully ponder them.
As reported in the Manchester Guardian, 1919:
“The hush deepened. It had spread over the whole city and become so pronounced as to impress one with a sense of audibility. It was a silence which was almost pain … And the spirit of memory brooded over it all.”
After the hymn, there were speeches, difficult to hear because of the incongruously loud generator (for the sound system) that we were standing beside, so we moved on.
The next ceremony we experienced we had walked through during setup. Surprised by the somewhat subtle but very present security perimeter around the Provincial Legislature, we eventually figured out that it was likely because the Lieutenant Governor (amongst others) would be speaking, along with other dignitaries at the Ontario Veteran’s Memorial.
As we walked around the back of the legislative building we discovered the other reason for the perimeter: Two howitzers set up, ready to give a 21-gun salute. One of the nice young soldiers in the safety perimeter kindly offered us ear protection just before the first gun fired. We demurred, which was likely a mistake, as the first shot startled us (and many squirrels). Through the scurrying squirrels, dissipating smoke, and car alarm sounds, it struck me as jarring that an occasion that was all about commemorating when the guns finally fell silent would include so many guns firing, along with a bomber flyover…but perhaps that helps remind people of the horrors of war.
After experiencing more than enough howitzer sounds (five), we moved on to the official University of Toronto commemoration ceremony at Soldier’s Tower. This was a very standard Remembrance day ceremony, with the chaplain talking about the act of love that is sacrifice in war. This was however somewhat marred by the sounds of howitzers in the distance, scaring the children in attendance, and making us jump.
There was one moment of humour, however. I do like the sound of church bells, but it is very difficult to exactly tune them. It’s been very strange having a King, after having a Queen almost longer than living memory. This was the first time we’d heard ‘God save the King’ as part of a ceremony, and the out of tune church bells delivering their almost mocking rendition of ‘God Save the Queen'[2] were an excellent counterpoint.
Last on our journey, we stumbled upon some UofT Engineers performing their (apparently) annual Remembrance Day ceremony, complete with specially built temporary memorial[3]:
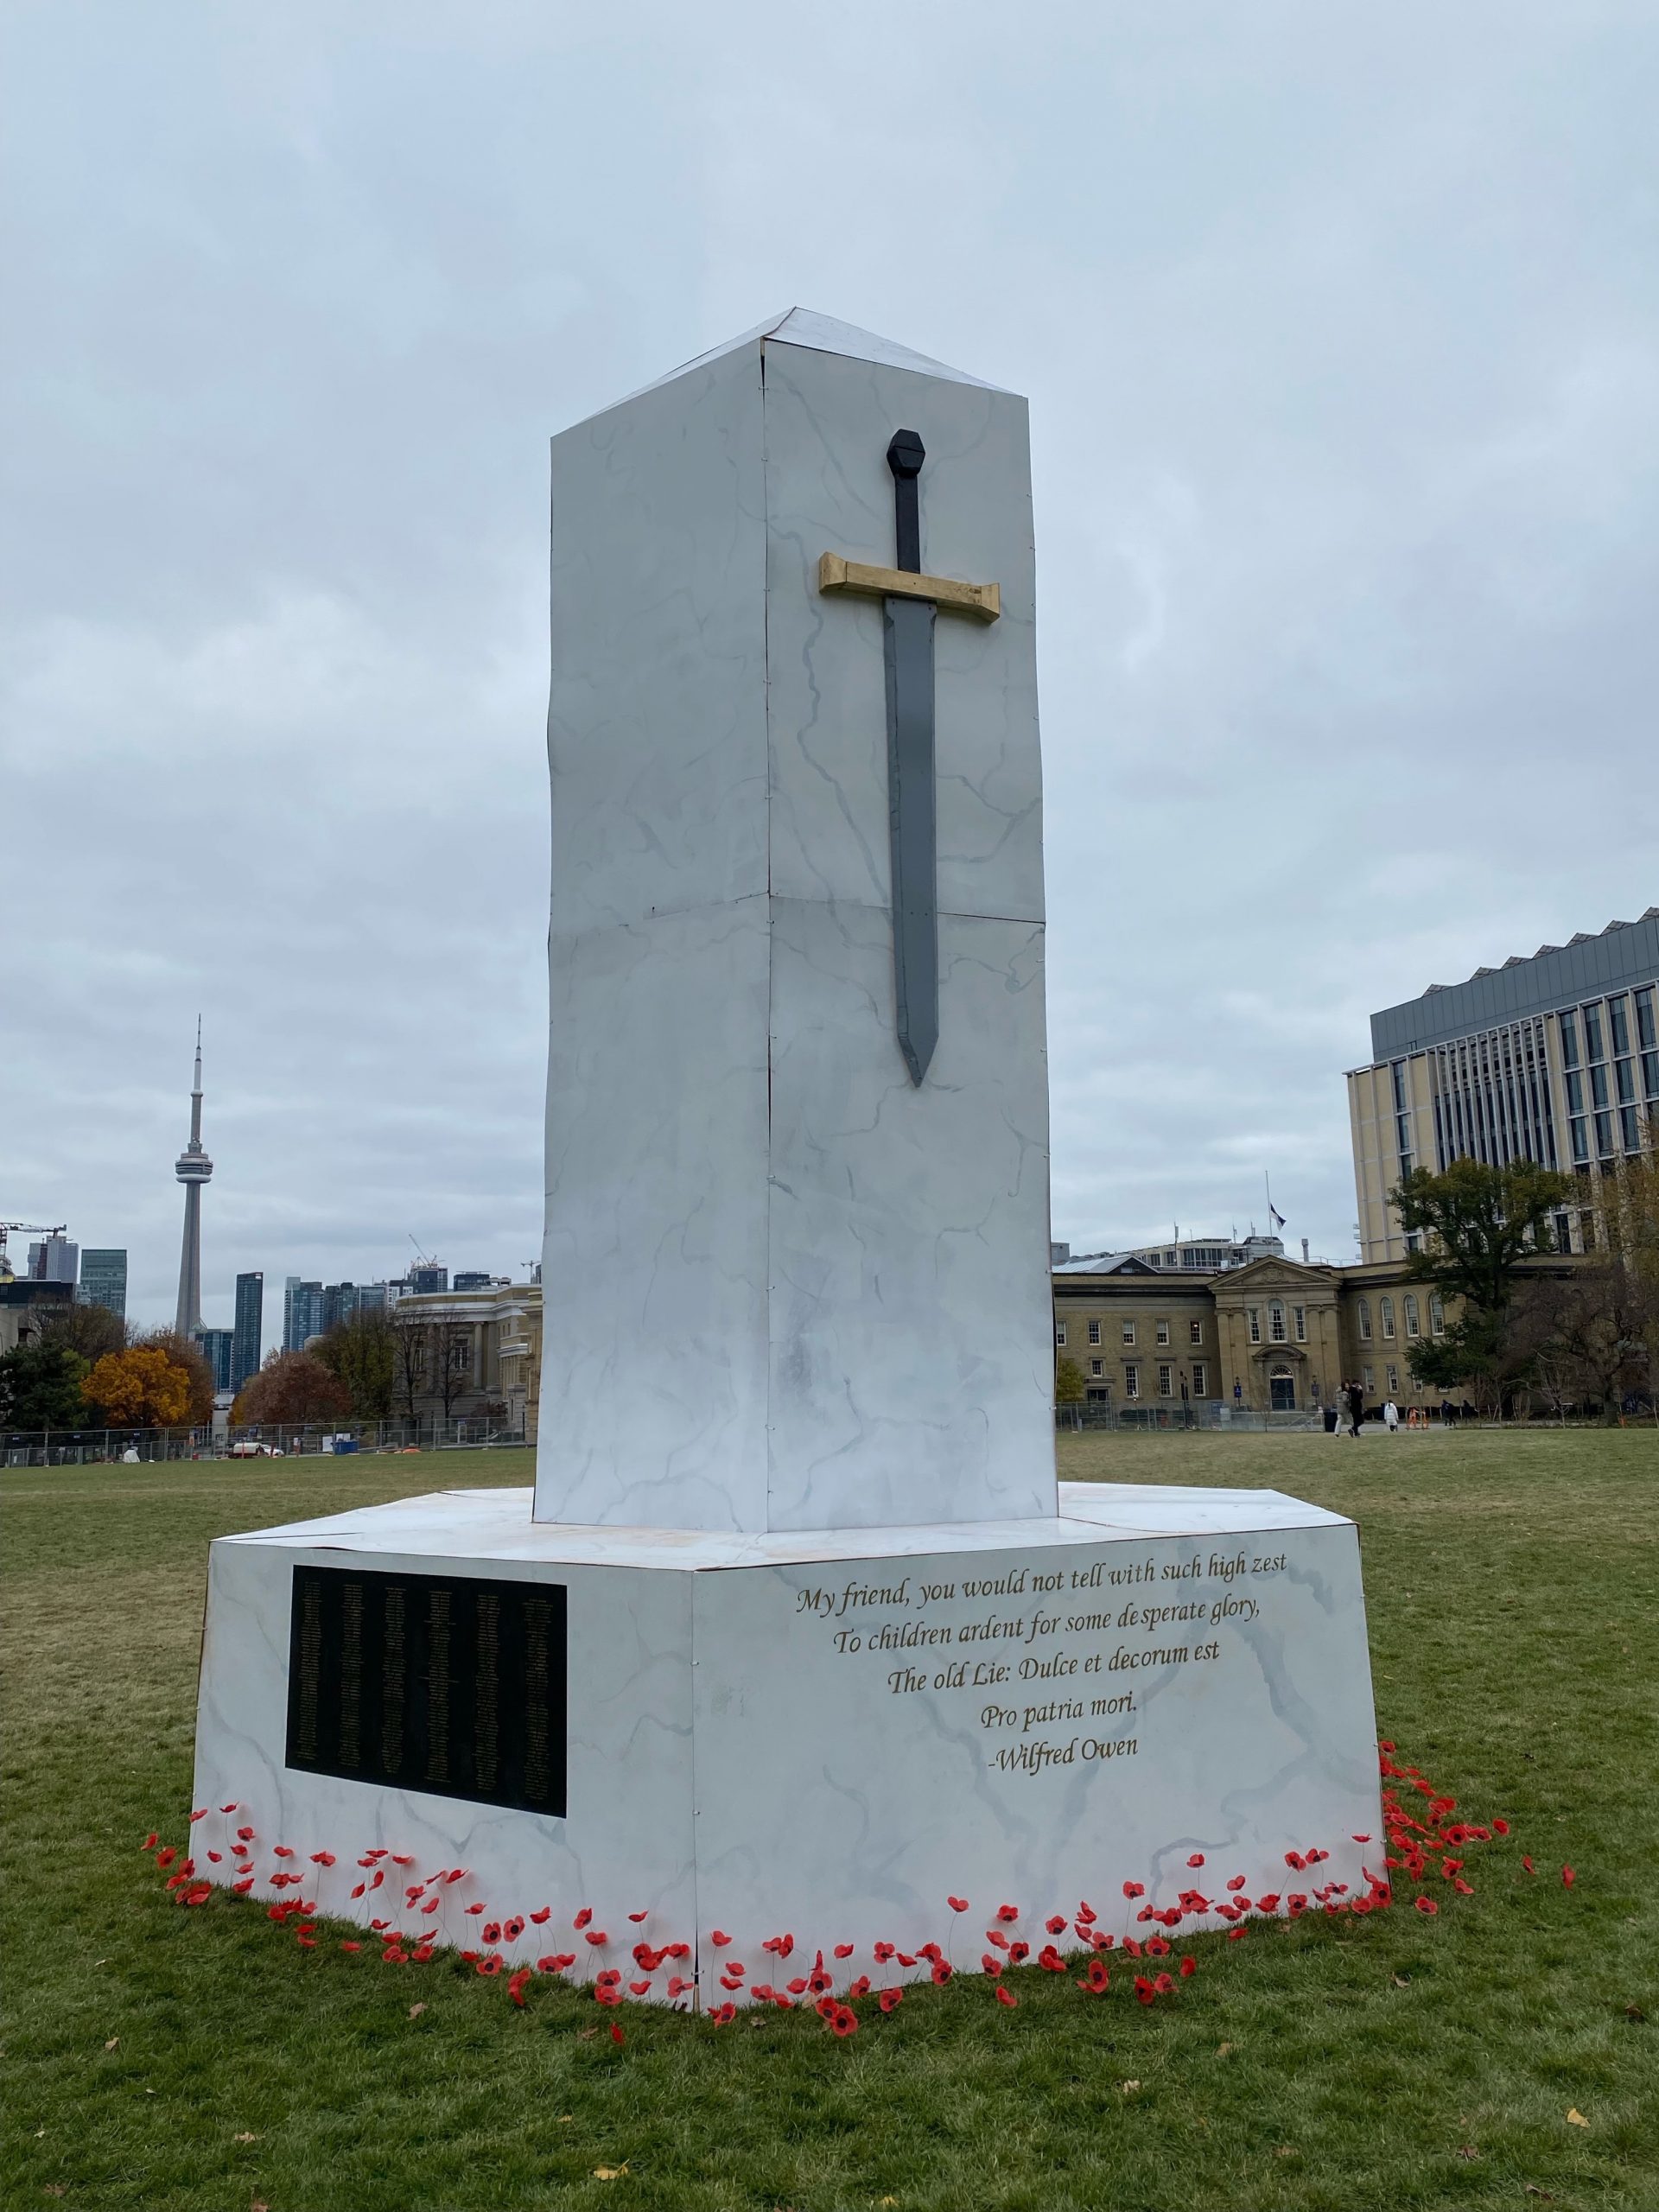
Of all the ceremonies, this was the one we identified with: They were engineers, they had built the memorial themselves, the ceremony was small and personal, and there was clear counter-cultural representation.
I thought the quote[4] they chose for the memorial (pictured above) was very important for Remembrance Day (and indeed any day people talk about the ‘Glory’ of war or its self-sacrifice):
“My friend, you would not tell with such high zest
To children ardent for some desperate glory,
The old Lie: Dulce et decorum est
Pro patria mori.”
It speaks to how in war, death is gross and horrific. Wilfred Owen was talking about the horrors of watching your friends die from a poisonous gas attack, but it can just as easily apply to death from anything else.
I think we do ourselves a disservice, especially in a time when war is again raging in Europe, to speak of the glory of war, or dying in war, particularly as a method of convincing people to participate. I believe that as mature individuals (and as a mature society), we can understand that war is horrific and terrible, and gross, but still have the maturity to understand that it is still sometimes a necessary sacrifice for freedom.
[1] I mostly know the 48th Highlanders through the excellent musicianship of their pipes and drums.
[2] It will always be ‘God Save the Queen’ to me.
[3] Another past memorial.
[4] ‘Dulce et decorum est‘, by Wilfred Owen