Inflation is supposed to be one, measurable number. There’s a number that’s quoted in all the newspapers, and is used all over the place, to help determine how well the economy is doing, to index pensions, to negotiate union contracts, etc, etc…
This is generally known as the ‘CPI’, or ‘Consumer Price Index’. I’ve reproduced the numbers for Canada from Statcan[1] below:
Consumer Price Index, historical summary
(1996 to 2015)   	All-items 	Change from previous year
  	2002=100 	%
1996 	88.9 	1.5
1997 	90.4 	1.7
1998 	91.3 	1.0
1999 	92.9 	1.8
2000 	95.4 	2.7
2001 	97.8 	2.5
2002 	100.0 	2.2
2003 	102.8 	2.8
2004 	104.7 	1.8
2005 	107.0 	2.2
2006 	109.1 	2.0
2007 	111.5 	2.2
2008 	114.1 	2.3
2009 	114.4 	0.3
2010 	116.5 	1.8
2011 	119.9 	2.9
2012 	121.7 	1.5
2013 	122.8 	0.9
2014 	125.2 	2.0
2015 	126.6 	1.1
These numbers should dovetail well with what you read in the news. They even nicely break the CPI down by type of item:
Consumer Price Index, by province (monthly)
(Canada)   May 2015 April 2016 	May 2016 April 2016 to May 2016 May 2015 to May 2016
  	2002=100 	% change
Canada
All-items 		126.9 	128.3 	128.8 	0.4 	1.5
Food 			140.8 	143.8 	143.3 	-0.3 	1.8
Shelter 		133.2 	134.9 	135.1 	0.1 	1.4
Household op & furn. 	119.7 	121.6 	122.1 	0.4 	2.0
Clothing and footwear 	95.0 	96.0 	96.0 	0.0 	1.1
Transportation 		128.0 	127.8 	129.4 	1.3 	1.1
Health and pers. care 	120.7 	122.2 	122.3 	0.1 	1.3
Rec, ed, & reading 	109.9 	110.3 	111.7 	1.3 	1.6
Alc. & tobacco products 151.9 	156.5 	156.8 	0.2 	3.2
Special aggregates
All items excl. food 	124.2 	125.3 	126.1 	0.6 	1.5
All items excl. energy 	124.8 	126.9 	127.2 	0.2 	1.9
Energy 			152.4 	143.4 	146.9 	2.4 	-3.6
Source: Statistics Canada, CANSIM, table 326-0020 and Catalogue nos. 62-001-X and 62-010-X.
Last modified: 2016-06-17.
But many peoples’ experience of inflation can be very different.
I’ll use an example near and dear to my heart:
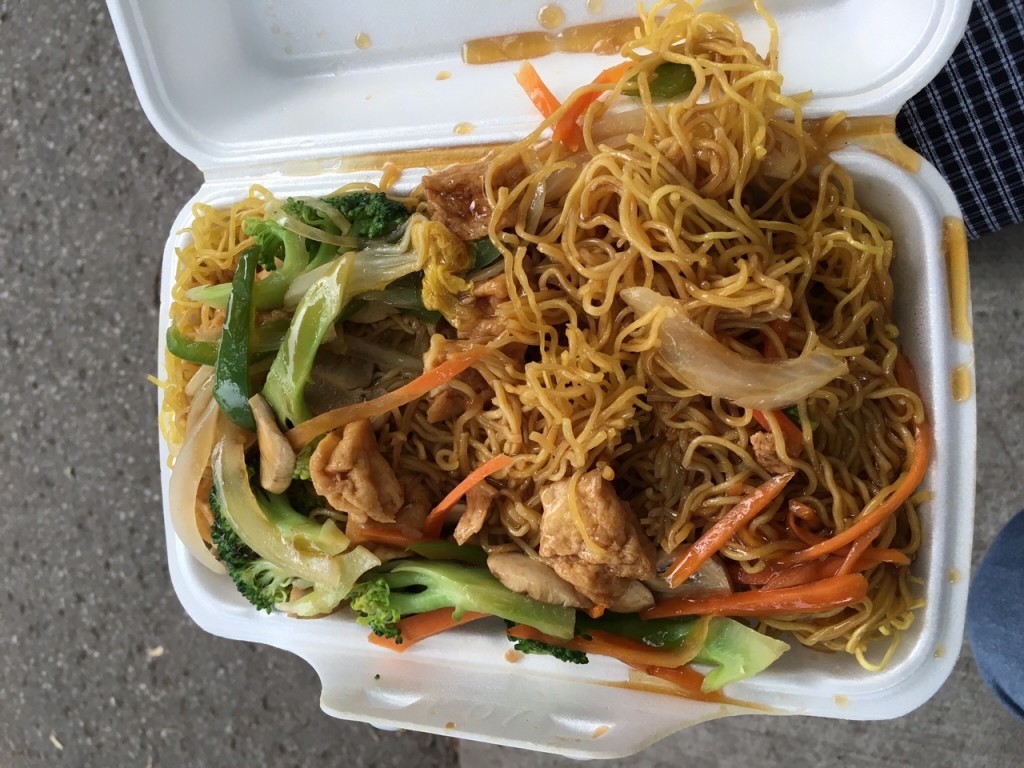
Today, I had the 
I first visited the Wokking on Wheels food truck sometime during the fall of 1996, when I was working on Calculus with J (Thanks, J!). At that time, they had five daily specials which, if I recall correctly, they were selling for $3.75. These included the special Thursday special, ‘Singapore Fried noodles’, which you could persuade them to add red sweet sauce to. Delicious!
Anyway, the Vegetable Chow Mein was the least expensive thing on their menu today, at $7.
So, 20 years later, how has inflation fared? By the CPI deflator above, you would expect a $3.75 item in 1996 to cost $3.75*128.8/88.9 = $5.43, about $1.50 less than the actual.
Even if you use the ‘food’ number above, you get: $3.75*143.3/88.9 = $6.04, or about $1 less than the actual.
There are a number of reasons for this (which are beyond the scope), but it’s enough for now to note that there are reasons that people have a different feeling of inflation than what is ‘official’.
[1]The numbers for Ontario seem to be about the same to me.