Category Archives: Analysis

Marginal Tax Rates II

So, after my last post on marginal tax rates, there were a few questions about what it was/why it was important/etc…

So, we can start with Wikipedia, but basically, the marginal tax rate is how much tax you pay on your last dollar of income. Or conversely, how much of your last dollar of income you keep. It is a measure of how incentivized the population is to do ‘just a little’ more work. In most modern societies, the tax structure is set up (at least in theory*) such that the more money you make, the higher the marginal tax rate, to try to even out the wealth distribution a little.

The previous post showed the following graph:
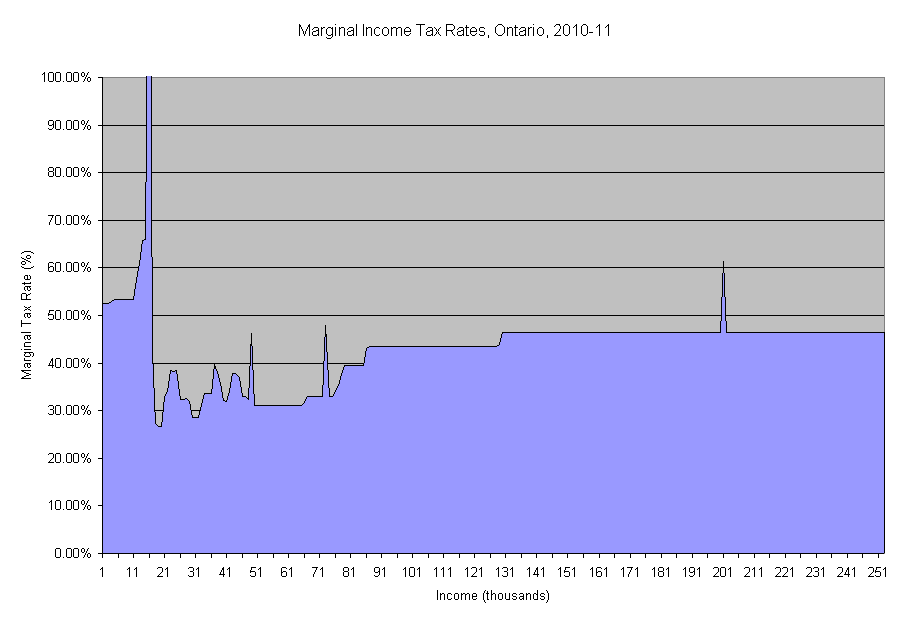
Marginal Tax Rates, Ontario, 2011

Which shows some of my inability to make a pretty graph with Excel, but more importantly shows that the marginal tax rate is highest for those making the least amount of money. This disincentivizes work (at least, not under-the-table work) among those on welfare. Most people who are interested in a rational economic and social policy think that this is insane. Not only are you discouraging those most desperate from working for a living, you’re also reducing the tax base at the same time.

Basically, if you’re on welfare, and get a part time job, you will lose more than half of your income to clawback and taxes.

You also create a large barrier to workforce entry, and encourage people to stay on welfare, rather than gradually bringing themselves out (this is also hard on those who can only work part time for family or other reasons).

There are a number of reasons why this might have been implemented like this, inertia combined with evolution, for one, but probably including a healthy dollop of Puritan “if you don’t succeed, you’re not trying hard enough”.

So, what should we do about this? I will leave most of that to the comments, but my assumption is that the goal is to have as large a portion of the population as possible productively employed (you can define this however you want), to the best of their abilities. There are a lot of things you can do with tax structure to accomplish this, but let’s start with the marginal tax rate.

*Capital gains taxes will likely be a later blog post here

Marginal Tax Rates

People talk a lot* about marginal tax rates**. You often hear that the income tax rate is going down from 16% to 15.5%, or that the highest marginal tax rate is now 29%. What we don’t talk about is the full structure of the tax system, and what the marginal tax rate is overall as you go up (or down) in income***.

Marginal Tax Rates, Ontario, 2011

Looking at the above graph, you may notice a few things. One is that the highest tax rates are paid by those with the least income (this is largely due to the 50% clawback of all income for those on welfare). The marginal tax rates for those earning less than $15k are never reached by anyone earning more than $15k. Many consider this a very strong disincentive to work (or at least a strong disincentive to report income).

There are a few oddities in the graph:
Around $15k, the spike is caused by the loss of the welfare prescription drug benefit
Between $43k and $49k, the tax rate decreases by about 7%, because Employment Insurance and Canada Pension Plan contributions max out
The spikes at $20-25k, $36-38k, $48k, $72k, $201k are caused by the strange way that the Ontario Government implemented the Ontario Health Premium

It might be interesting to overlay this graph with a graph of what percentage of the population is in each category, and what percentage of each of those groups vote.

-Nayrb

Some calculations:

Welfare: $224 basic needs, $368 shelter allowance
Welfare: $592/month = 7104 + 848/yr = 7952/yr
(includes ** Includes 2010 Ontario Energy and Property Tax Credit and 2010-11OntarioSales Tax Credit.)

*Well, probably not that much.
**Marginal tax rates in this instance are defined as the amount of tax paid per thousand dollars of income (marginal tax rate at $10k income would be: (Tax paid @$10k-Tax paid @ $9k)/$1000 )
***This post assumes Toronto, Ontario residents, 2011 tax rates, single adult

References:
http://www.socialassistancereview.ca/income-assistance-and-other-benefits
http://www.mcss.gov.on.ca/en/mcss/programs/social/directives/directives/ODSPDirectives/income_support/6_1_ODSP_ISDirectives.aspx
http://www.rev.gov.on.ca/en/taxcredits/CalculatorQuestions.asp
www.caledoninst.org/Publications/PDF/488ENG.pdf
http://www.e-laws.gov.on.ca/html/regs/english/elaws_regs_980134_e.htm#BK59
http://www.cra-arc.gc.ca/E/pub/tg/rc4210/rc4210-e.html#P137_11147
http://www.cra-arc.gc.ca/tx/ndvdls/fq/txrts-eng.html